Every year, over on my personal blog, I write a round-up post covering what I have done during the year. This includes books read, films watched steps taken etc. What it has never covered are my creative endeavours which would be my developments over at Github and my blog posts.
Where are the WordPress Stats?
I sort of assumed that there would be stacks of stats in the WordPress dashboard but no if you want that you have to install Jetpack and get the nagging messages asking you to upgrade. These stats are very similar to what you might see with other analytics solutions such as Google Analytics.

It is with a heavy sense of irony that immediately after viewing the stats for this site on Jetpack, I received an email informing me that my site had been reclassified as a commercial site, and I needed to pay to continue to get access to the stats.

I don’t consider the site to be commercial as I make approximately £2.50 a month in ad revenue – that’s really not going to keep the wolf from the door. The other reason I have no intention of upgrading is because these stats are all about visitors and that’s not what I wanted for this project. Incidentally, if I did want visitor numbers, I would switch to Independent Analytics, which gives me all I need for free.
Rolling my Own
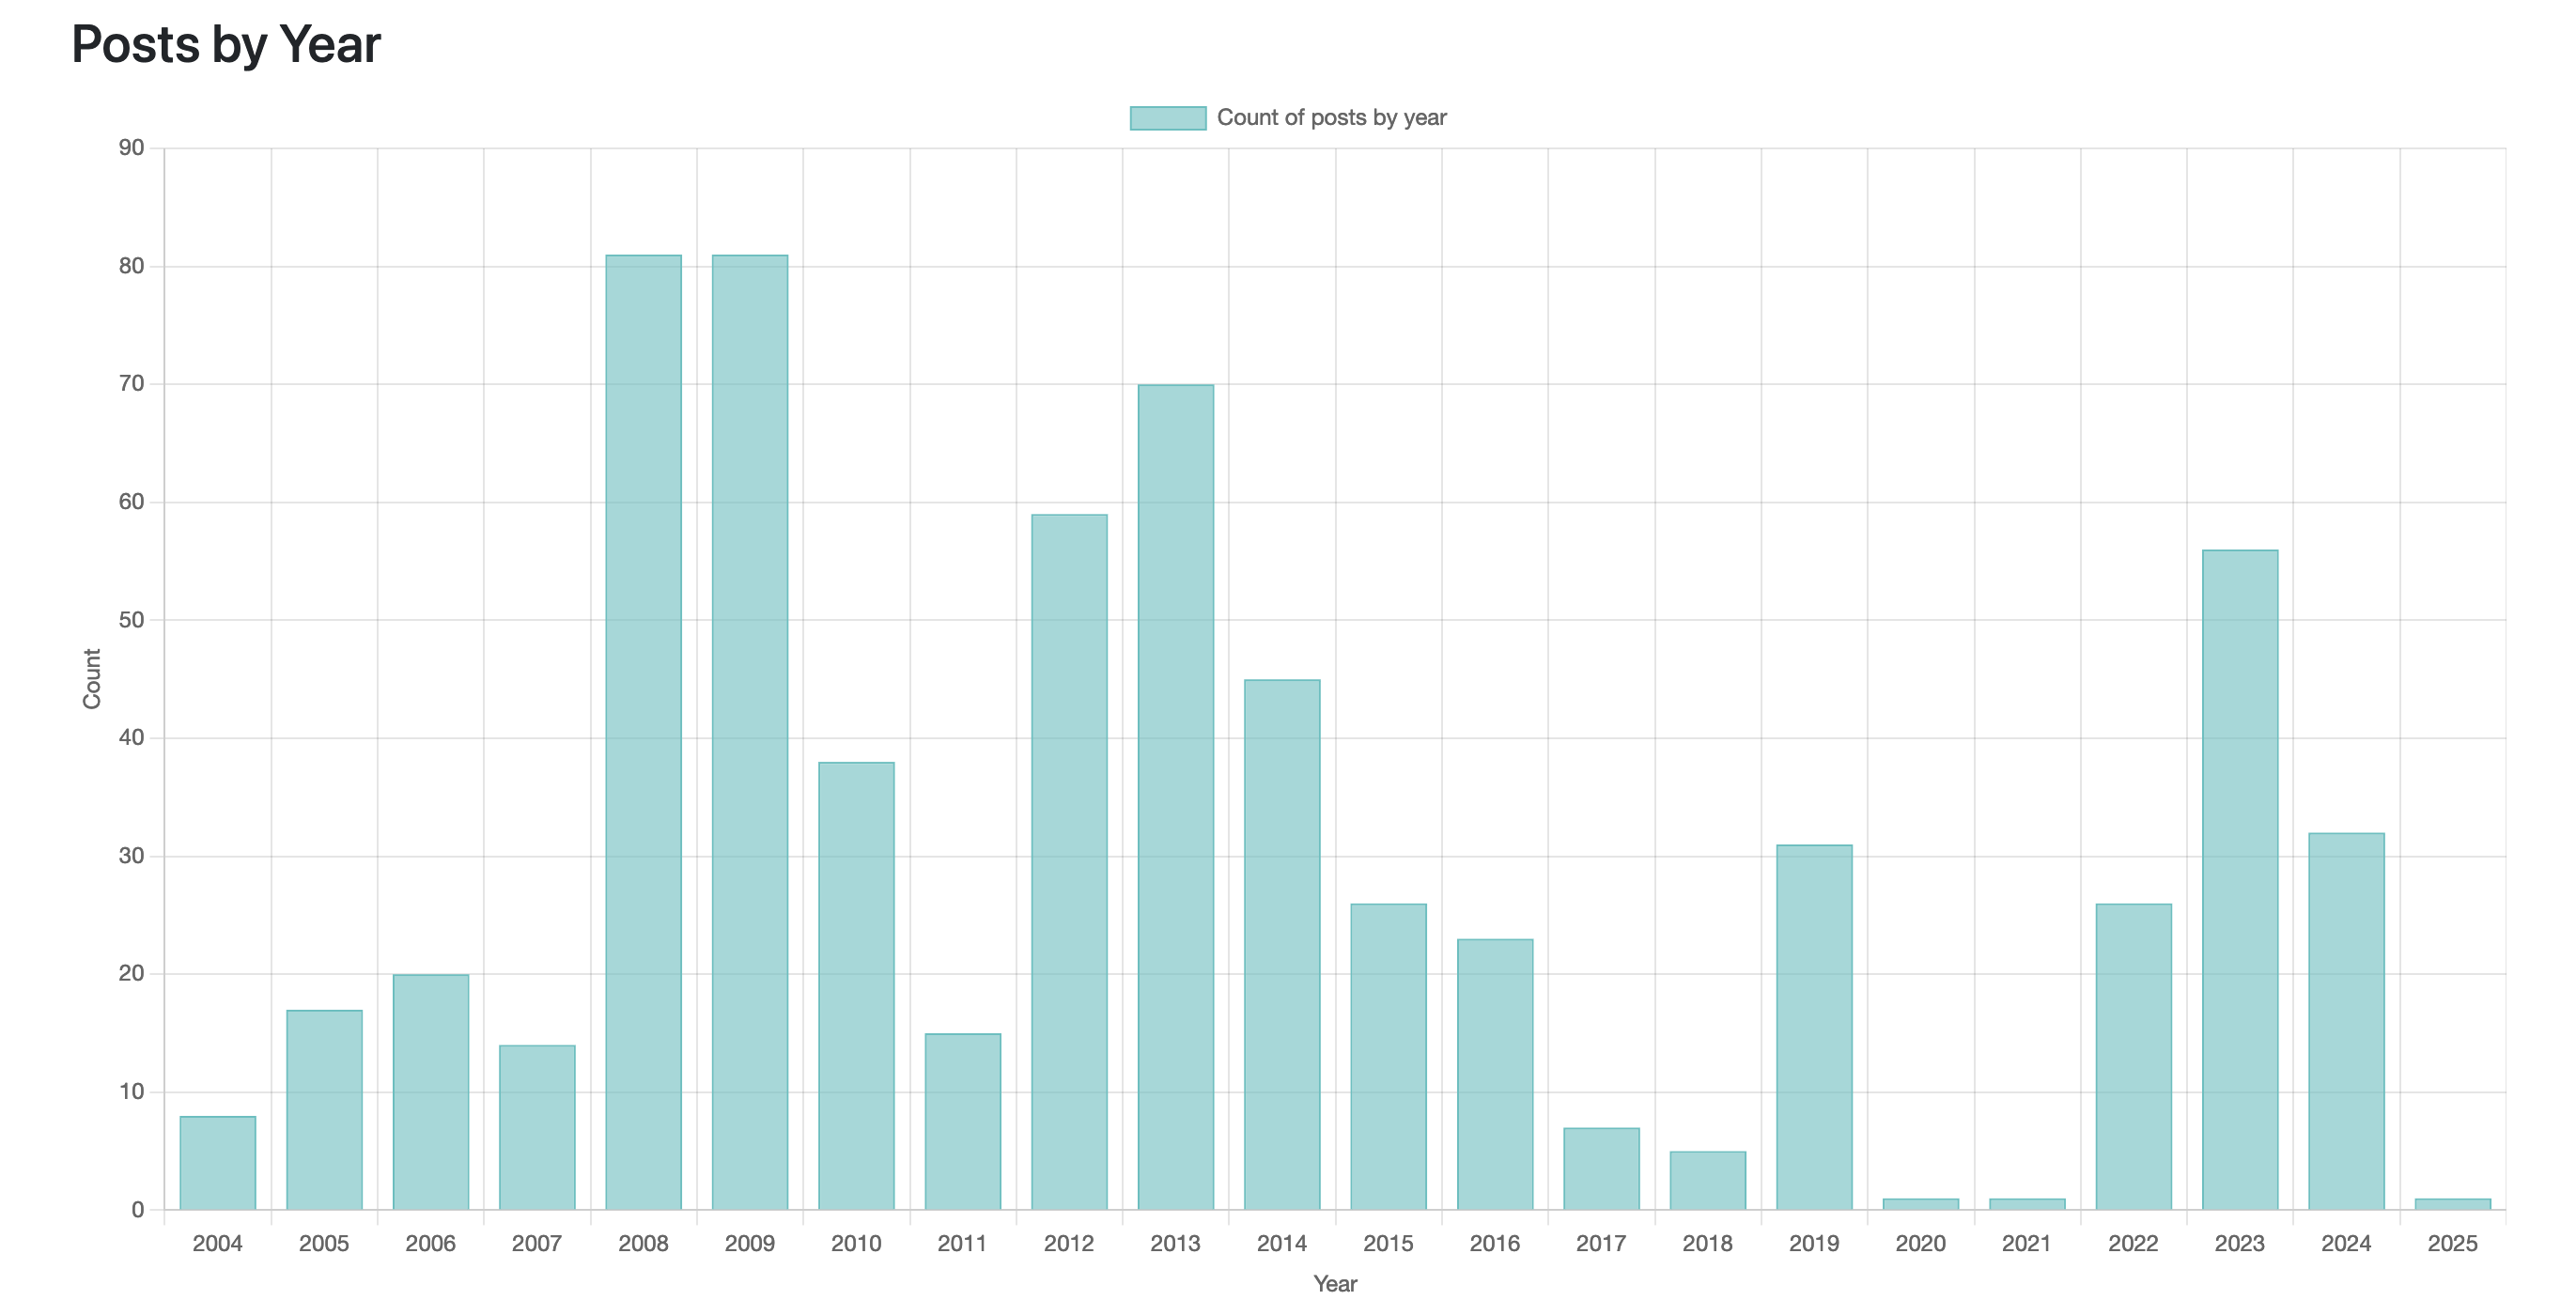
What I was interested in for my round-up post was things like, how many posts have I written this year? How does that compare to last year? What do I write about, and when do I do it? All of which could be simply achieved.
WordPress has a pretty good API to work with which I had used before on a project to export my posts in PDF format so I went to that to get the information I wanted.
An important note at this point that all here applies to self-hosted sites and not those at WordPress.com. It may work but I have no experience of that so I don’t know.
Extracting the Required Information
To do what I wanted to do I required a very small amount of information and the process was as follows:
- cycle through all the posts on a given blog
- extract for each post the post date, categories and tags
- count up the year, month, day, categories and tags
- display in an interesting way.
You can see all the code on my Github page but picking out one interesting area that’s worth picking out is the selection of the categories and tages from the rest of the post details. This snippet of code cycles through all of the WP Term object extracting from that the taxonomy which holds the tags and categories:
// grab any categories and tags
$tax = $posts[$i]['_embedded']['wp:term'];
$j = 0;
while ($j<count($tax)){

    $tmp = $posts[$i]['_embedded']['wp:term'][$j];

    $k = 0;
    while ($k<count($tmp)){

        if ($posts[$i]['_embedded']['wp:term'][$j][$k]['taxonomy'] == 'category'){
            if (isset($categories[$posts[$i]['_embedded']['wp:term'][$j][$k]['name']])){
                $categories[$posts[$i]['_embedded']['wp:term'][$j][$k]['name']]++;
            }else{
                $categories[$posts[$i]['_embedded']['wp:term'][$j][$k]['name']] = 1;
            }
        }elseif($posts[$i]['_embedded']['wp:term'][$j][$k]['taxonomy'] == 'post_tag'){
            if (isset($tags[$posts[$i]['_embedded']['wp:term'][$j][$k]['name']])){
                 $tags[$posts[$i]['_embedded']['wp:term'][$j][$k]['name']]++;
            }else{
                 $tags[$posts[$i]['_embedded']['wp:term'][$j][$k]['name']] = 1;
            }
         }
         $k++;
     }

     $j++;
}
chart.js and Bootstrap were then used to produce a simple, single page, web site graphing the results. You can see the output from this site at the bottom of the page.
Possible Enhancements
Running the script with lots of posts to process is time-consuming and can take longer than the default PHP processing time, so caching previous years’ data in a SQLite database would be my first change. I’d also be interested to see how tags added to posts have changed over the years and whether they reflect my interests and technology changes.
Until I get round to version two with caching you might light to take a look at the intial release which can be found over on my Github page.

Maybe Matomo / Piwik is an option ? At the moment you created your own solution. But I am using Matomo for years because I do not like Google’s Analytics. Dont ask why 😉
Matomo is offering, even without paying for a commercial license, really a lot of services. And lately their plugin repository is growing almost daily.
It was just meant as a suggestion. Enjoy your weekend!
If you find a better way of doing it please let me know!